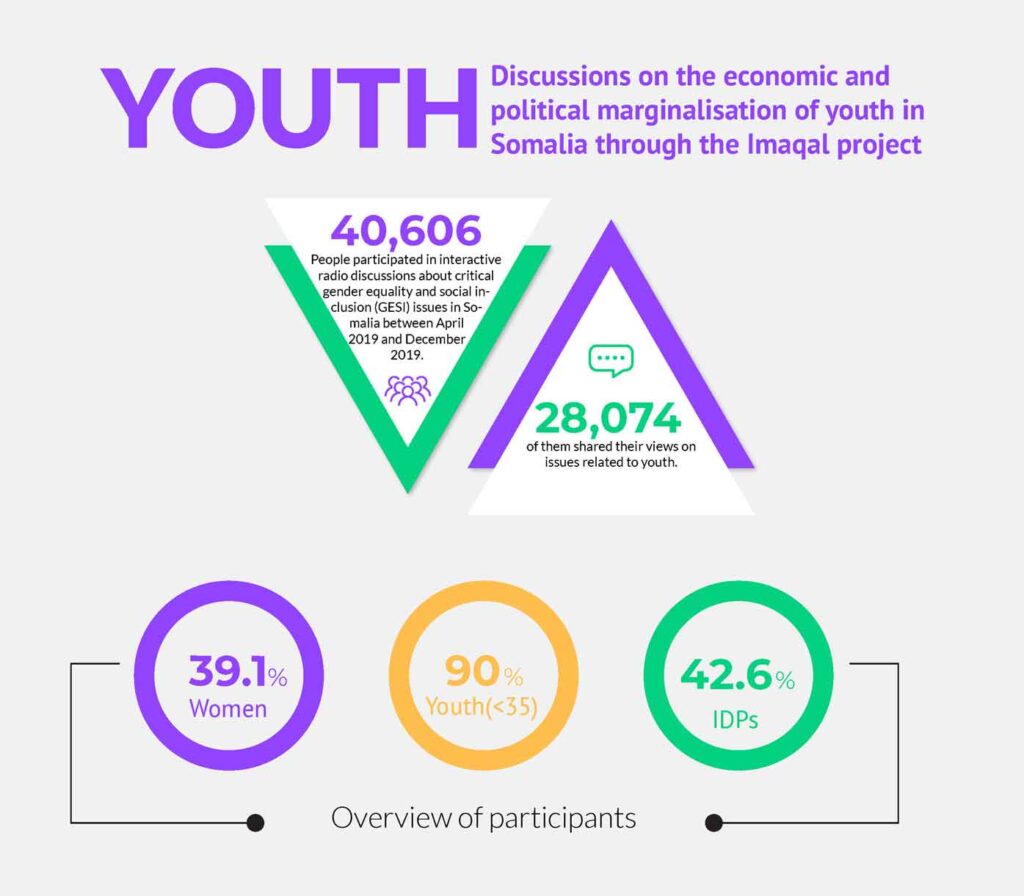
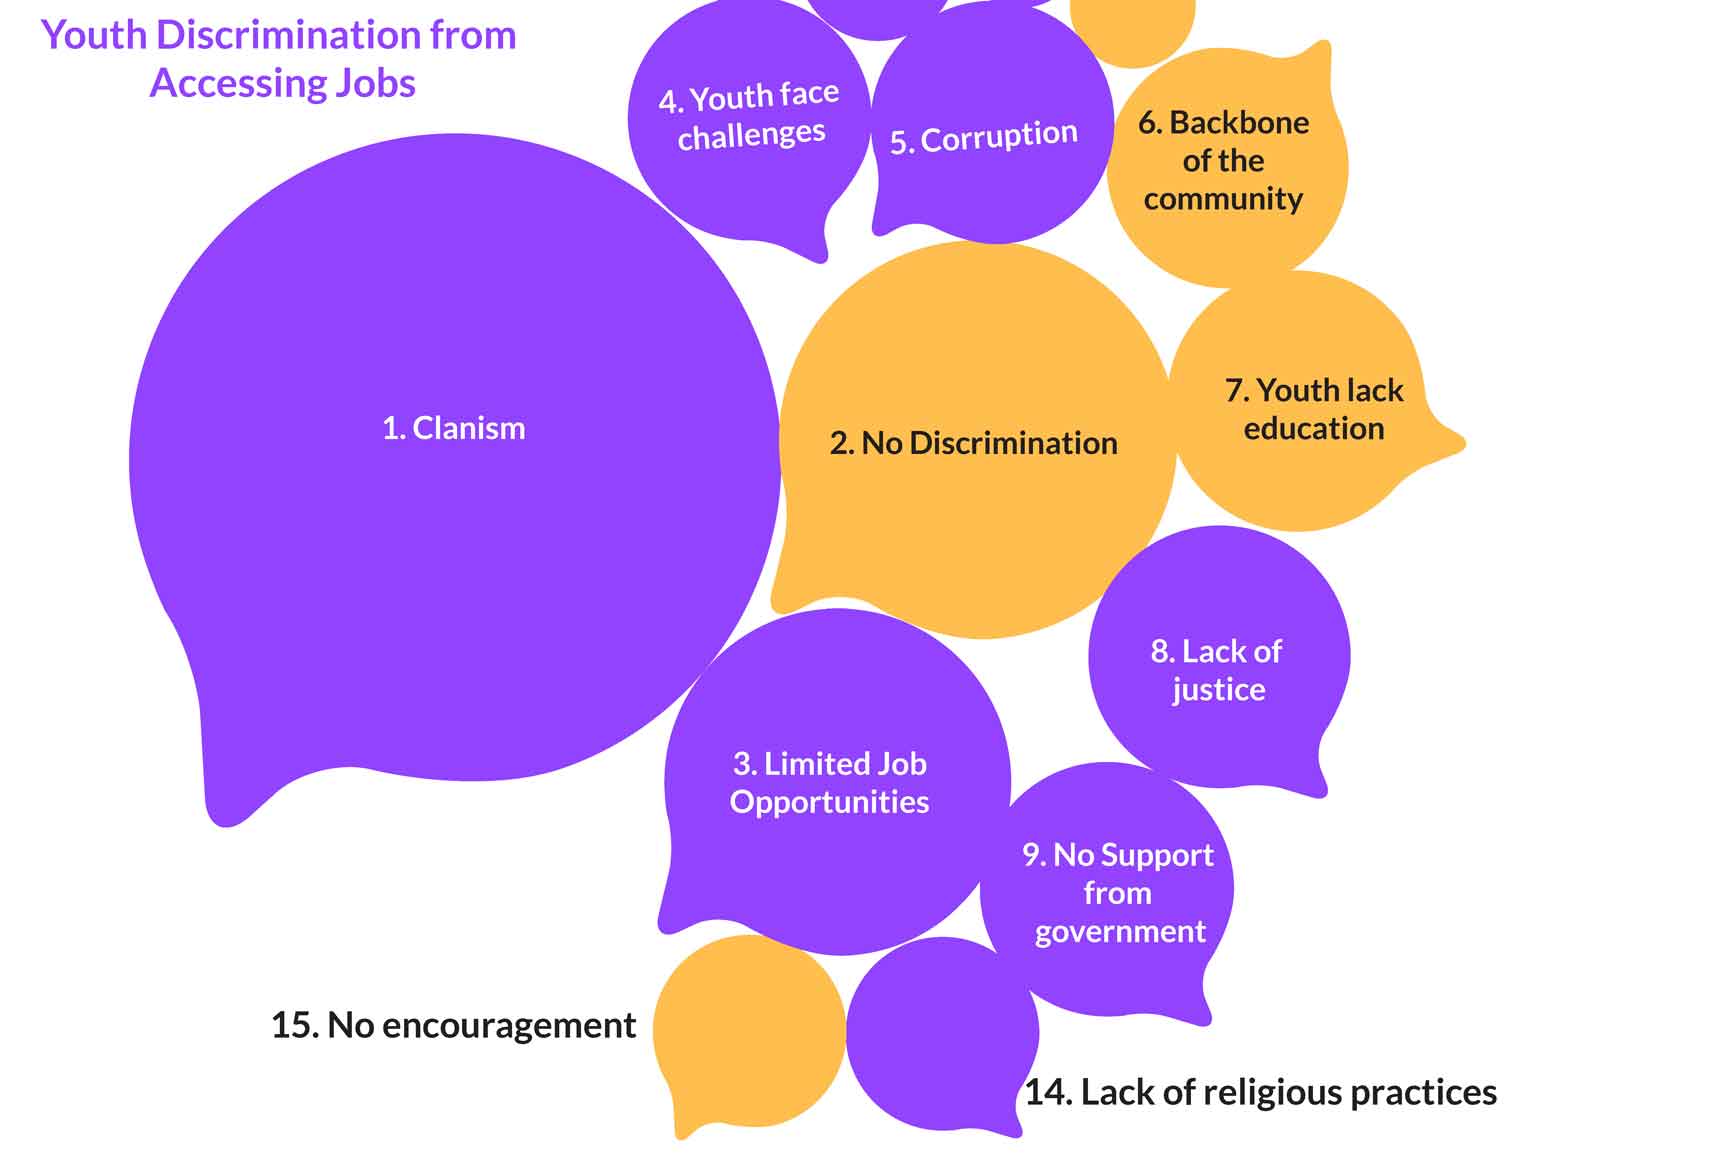
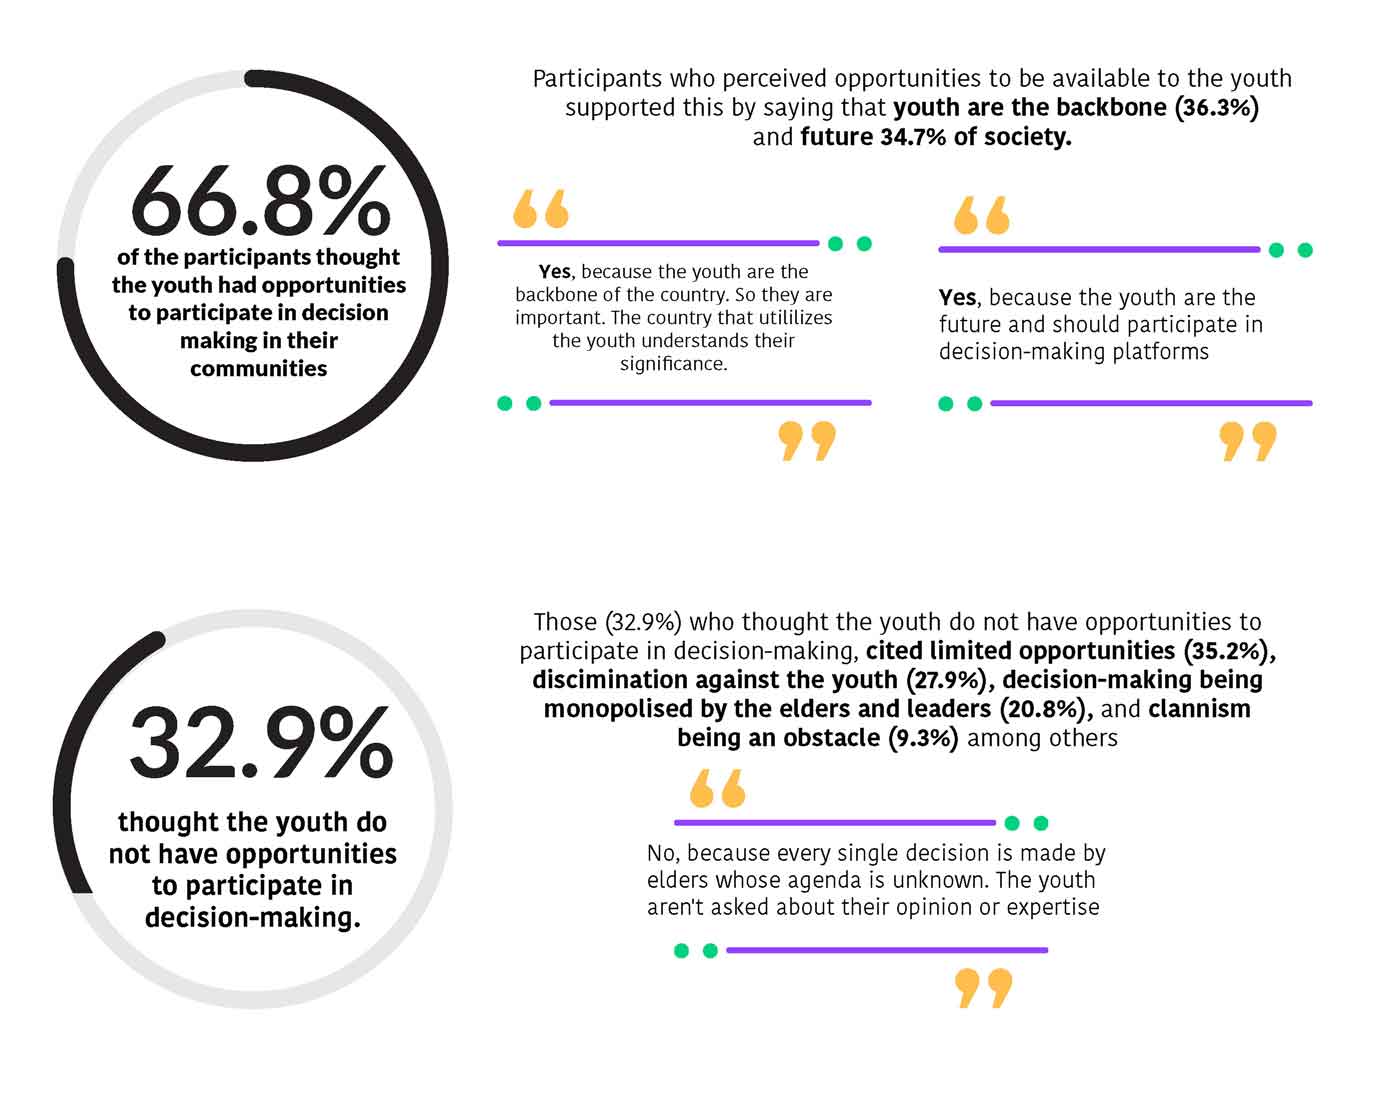
In an era marked by information overload, organizations are increasingly faced with the challenge of navigating a vast sea of data. With access to an abundance of information, transforming that data into meaningful insights can feel like an overwhelming task. Every day, stakeholders encounter detailed reports filled with intricate numbers, graphs, and industry-specific jargon, often leaving them confused and frustrated. If you’ve been searching for an effective way to communicate complex information and engage your audience, look no further. Infographic design is the key to turning intricate data into clear, compelling visuals that resonate with your audience and empower decision-making.
The Power of Infographics
Infographics are not merely decorative elements; they are powerful visual storytelling tools that combine graphics, data, and narrative elements. By presenting information in a visually appealing format, infographics can simplify complex ideas and make them easily digestible. Instead of wading through dense reports laden with jargon, stakeholders can quickly grasp essential insights thanks to the visual representation of data. As businesses increasingly recognize the value of infographics in their reports, marketing materials, and presentations, they unlock the true potential of visual communication.
But what makes infographics so effective? One significant reason is that our brains are wired to process visuals much more quickly than text. Research shows that we can process images 60,000 times faster than written words, making infographics an ideal medium for succinctly conveying complex information.
Why Use Infographics in Business Reporting?
Simplifying Complexity
Let’s face it: business reports can be overwhelming, even for seasoned professionals. Infographics distill critical information into core messages and visual formats, simplifying this complexity. Instead of presenting a lengthy report on customer satisfaction survey results, a well-crafted infographic can highlight essential statistics, such as the percentage of satisfied customers, common pain points, and actionable recommendations. This visual representation allows stakeholders to absorb the main takeaways quickly, paving the way for better decision-making.
Imagine presenting a complex data set as a visual narrative. Instead of inundating your audience with a wall of text, you can showcase the key insights through charts, icons, and color coding. For instance, an infographic detailing customer satisfaction can visually illustrate various data points, transforming a lengthy report into a straightforward yet effective visual. By breaking down data into smaller, manageable pieces, infographics enable audiences to grasp critical insights without feeling overwhelmed.
Engaging the Audience
In any business setting, capturing your audience’s attention is paramount. Infographics enhance engagement by utilizing appealing design elements like colors, icons, and images to create a visually stimulating representation of data. When statistics are transformed into compelling narratives, they become relatable and easier to digest. For example, an infographic illustrating the success of a new marketing strategy could feature visuals of rising sales, customer testimonials, and social media engagement metrics, turning dry data into an engaging story.
Engagement goes beyond simply presenting information; it’s about making that information stick. A well-designed infographic can transform dry statistics into compelling narratives that resonate with the audience. For example, an infographic outlining the impact of a new marketing strategy can incorporate visuals of increased sales, customer testimonials, and social media engagement metrics, weaving together a story that connects with the audience emotionally. When data is presented in this way, stakeholders are more likely to remember and act upon the insights provided.
Facilitating Retention and Recall
People are far more likely to remember information presented visually than through text alone. Infographics enhance retention by blending visuals with concise text, creating a memorable experience. Color coding, imagery, and thematic elements reinforce key messages, making it easier for audiences to recall essential information long after they’ve viewed the report. For instance, a company can utilize an infographic to highlight its annual performance metrics, showcasing achievements and areas for growth in a manner that sticks with stakeholders.
Consider the difference it could make if your team could recall essential data from a presentation months after it was delivered. Infographics improve retention by combining visuals and succinct text to create a memorable experience. The use of imagery, color coding, and thematic elements reinforces key messages, ensuring stakeholders can easily recall important information during future discussions. For example, if a company is presenting its annual performance metrics, using an infographic to highlight key achievements, growth areas, and future goals can ensure that stakeholders retain that information for strategic planning.
Catering to Diverse Audiences
In today’s interconnected world, business reports are often shared with diverse audiences, each with varying levels of expertise. Infographics bridge these gaps by presenting information in an accessible format. Whether your audience consists of executives, team members, or external stakeholders, infographics can convey complex ideas without alienating anyone. By employing clear visuals and straightforward language, you ensure that your message resonates with all segments of your audience.
In the global business landscape, reports are frequently shared with diverse audiences—each with different levels of expertise and familiarity with the subject matter. Infographics cater to these differences by presenting information in a format that appeals to everyone, regardless of their background. Whether your audience includes executives, team members, or external stakeholders, infographics help bridge knowledge gaps. By using clear visuals and straightforward language, you create infographics that effectively communicate complex ideas without alienating any audience segment.
The Impact of Infographics on Business Communication
Infographics are not just tools for presenting information; they can transform the way organizations communicate both internally and externally. By integrating infographics into your communication strategy, you can achieve several key benefits:
Enhanced Collaboration
Infographics promote collaboration among team members by providing a common visual reference point. When everyone can see the same data presented clearly and engagingly, discussions become more productive, and decisions can be made faster. Team members are more likely to engage in conversations when they can refer to visuals that illustrate key points. This shared understanding leads to more informed decision-making and better outcomes.
Building Brand Identity
Infographics can also serve as a powerful branding tool. By incorporating your brand’s visual elements—such as color schemes, logos, and typography—into your infographics, you reinforce your brand identity while communicating important information. This consistency helps your audience recognize your brand, fostering trust and familiarity. When clients encounter your brand visually represented in infographics, they may associate it with quality, professionalism, and clarity, thereby strengthening your brand image in their minds.
Driving Audience Engagement
The shareable nature of infographics makes them ideal for digital marketing and social media strategies. A well-designed infographic is more likely to be shared across platforms, reaching a broader audience. This not only increases visibility but also positions your brand as a thought leader in your industry. When potential clients come across your infographics, they may think, “This company understands complex information and can help us navigate our challenges.” This engagement can lead to inquiries and new business opportunities.
Encouraging Data-Driven Decisions
With infographics simplifying complex data, businesses can foster a culture of data-driven decision-making. When teams can easily access and understand data through infographics, they are more inclined to base their decisions on evidence rather than assumptions. This shift enhances overall organizational performance and drives growth. By making data accessible and engaging, you empower your team to leverage insights that can propel your business forward.
Support for Presentations and Pitches
Infographics can also play a significant role in presentations and pitches. When presenting to potential clients, stakeholders, or investors, clear visuals can effectively convey your message and strengthen your argument. Infographics can summarize key points, highlight essential data, and showcase your ideas in a way that resonates with your audience. Instead of overwhelming them with data-heavy slides, infographics create a compelling narrative that keeps them engaged and interested.
For example, when pitching a new project or initiative, incorporating infographics to highlight projected outcomes, market research, and competitive analysis can strengthen your case significantly. This visual storytelling approach not only captivates your audience but also instills confidence in your ability to deliver on your promises.
Conclusion
In an age where data drives decision-making, the ability to present complex information clearly and engagingly is crucial. Infographic design serves as a bridge between data and understanding, transforming intricate business reports into visual narratives that resonate with stakeholders across various sectors.
By simplifying complexity, enhancing engagement, and improving retention, infographics empower businesses to communicate vital insights effectively. When executed well, they become powerful tools for driving strategic decisions, fostering collaboration, and achieving organizational goals.
As companies navigate the information age, investing in quality infographic design will enhance their reporting processes and revolutionize how they communicate critical insights. By transforming complex data into engaging visuals, organizations can foster deeper understanding and retention among stakeholders, ultimately driving informed decision-making. This strategic investment will empower businesses to articulate their narratives more effectively, ensuring that key messages resonate across all levels of the organization and inspire action.
In summary, the integration of infographics into business reporting is not just an aesthetic enhancement; it is a crucial step toward better communication and decision-making in an increasingly complex world. By adopting this visual storytelling approach, organizations can bridge the gap between data and comprehension, fostering an environment where informed decisions are made based on clear, actionable insights. With the right tools and techniques, any organization can harness the power of infographics to convey their story, engage their audience, and drive meaningful results.